Precision agriculture tools such as global positioning systems (GPS) and geographic information systems (GIS) have greatly changed agriculture by enhancing our ability to collect and analyze spatial data to improve decision making. Spatial technologies take advantage of these tools to allow producers to vary application rates across fields, which allows for improved input efficiencies.
Spatial technologies for site-specific crop management such as variable-rate seeding, fertilizer application, and irrigation are beginning to influence the way we farm. These precision agriculture technologies not only allow us to distribute input at different rates across a field, but they provide the opportunity to track where those inputs are placed. This ability to geo-reference field operations (store locations using GPS coordinates) can be a powerful tool for those wanting to further analyze their operations and conduct their own field trials.
Using these tools, treatment comparison strips can be located without having to use flags. (It’s still recommended to at least flag the beginning and end of the research trial.) Field trials can be preprogrammed using prescription mapping software (for planting or fertilizer applications) to set up your research plots. Yield monitor data is just one example of a spatial technology that we have been using for many years. Now, in-cab monitors that control application equipment (planters and fertilizer applicators, for example) can record as-applied files which can later be compared to yield data for making important comparisons.
Identifying trial locations that will minimize errors during analysis can be challenging. Using past yield data can be beneficial when planning locations for your field trials. While multiple years of yield data would be preferable, a single year’s data can be very informative. For example, in the field shown in Figure 10, two areas (zones 1 and 2) had significantly lower yield values from last year’s soybean harvest. Should a test trial (outlined in white) contain one of these areas, there could be a noticeable yield difference in the lower yielding area (in this case, two areas affected by drainage issues). This would ultimately affect the test trial results.
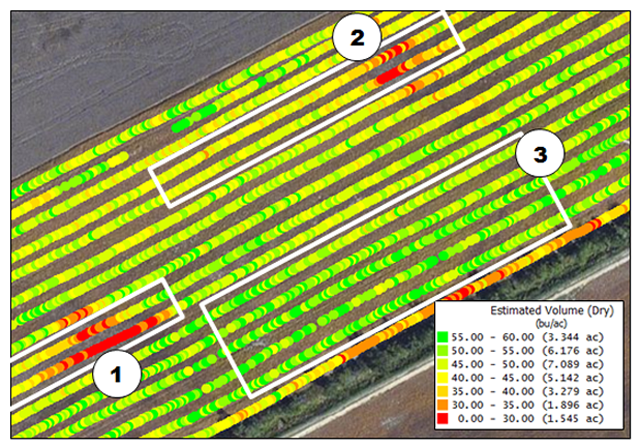
A better option would be to include the test trial in an area within zone 3 where less yield variation was observed. If multiple years of yield data were available, analysis may indicate even more stable areas of the field where year-to-year variation is minimized.
Planting with Technology
Let’s say you decide to do a corn plant population study with a specific hybrid to determine the most profitable corn plant population for a field. Plant populations of 22,000, 26,000, and 30,000 seeds per acre are selected for the field. Using a soil map and yield map of the field, you find a uniform area that has similar soil texture, topography (land surface features such as hills, streams, etc.), and yield.
Planting at the three seeding rates can be accomplished in two ways. First, a seeding rate prescription map may be developed using farm management software (Farmworks or AgLeader SMS, for example). The seeding rate prescription map would then be uploaded to the in-cab monitor that controls the variable-rate planter.
One important note regarding prescription maps: While the equipment is programmed to plant at the prescribed rates, variations may occur during planting that are not visible in the prescription map. In this case, an as-applied map would be preferable in that often these maps will identify seeding rate variation during Planting.
A second option does not require use of the computer software to plan the field plot. Many in-cab monitors will allow multiple seeding rates to be input for each field. Using this function, it may be possible to input the three test plot seeding rates into the monitor to simply change the rate on different field passes. In this case, without a prescription map, it will be important to ensure that the monitor can create an as-applied map which records the seeding rates across the field.
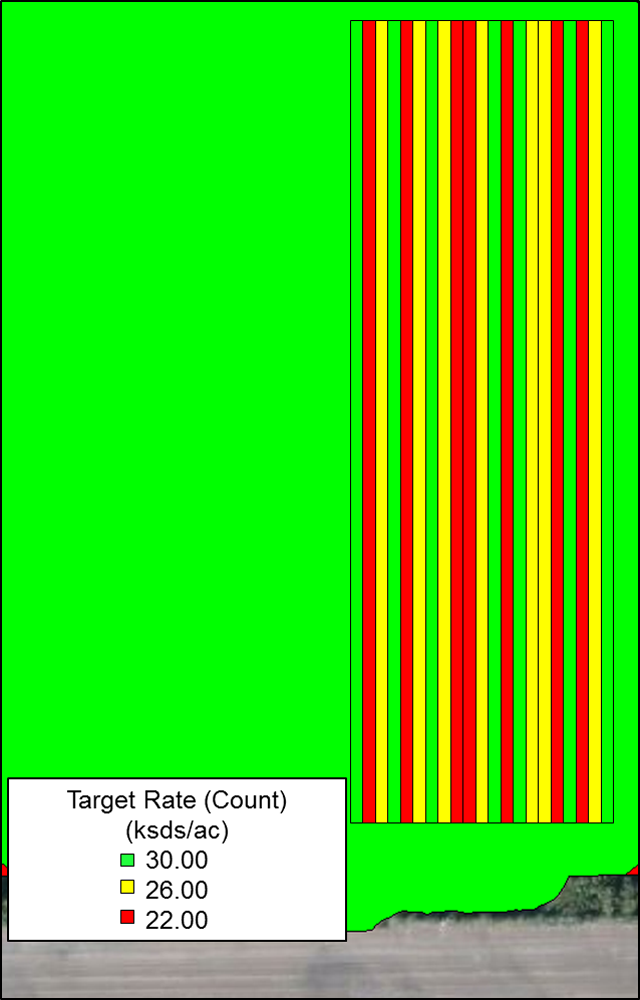
Planning the field plot design requires some knowledge of the analysis that will be performed to compare the treatments (in this case, seeding rate). It is important in most plots to perform a randomized, replicated design so multiple values are available for the comparison analysis. With a planting prescription map, the field plot design should already be incorporated into the system. When changing rates manually on the in-cab monitor, take care to ensure that the field plot design is being utilized properly. In most cases, the comparison field strips should be planned to ensure each treatment is replicated five times, giving five randomized blocks. Figure 11 shows an as-applied seeding rate map created after planting using GPS.
Harvesting with Technology
At harvest you may program your yield monitor to separately harvest and record the yield for each comparison field strip. (See Figure 11 for an example.) However, since the yield data are geo-referenced using GPS, this step is often not required and the analysis can use the entire field harvested as one load. To simplify the analysis, it may be helpful to harvest areas not within your study (end rows, for example) as one load, then set up a separate load for harvesting all of your study plots. When using your yield monitor to check yield in comparison strips, it’s important that you do not start forming conclusions about which treatment is better or worse. It also is important that your yield monitor systems be accurately calibrated to provide accurate yield estimates.
Cleaning & Importing Data
Improving the quality of yield data is an important process that should not be ignored during yield trial analysis. Yield data errors can come from a variety of sources during field operations. In general, these errors tend to lower yield estimates; however, in some cases, it is possible for yield data to be falsely reported as much higher than actual values. In any case, when conducting a treatment analysis, the yield data should be cleaned or filtered to remove as many of these errors as possible. Yield Editor, software available free from USDA, is a valuable resource for removing errors from your yield data.
After harvest, the seeding rate and yield data need to be transferred to your computer. Import the field’s soil map into the program and specify the zone of the map. A soil map also may be downloaded and used in the analysis. The program automatically overlays the three maps: planter, yield, and soil. With GIS technology, the data can be analyzed to identify how the yield was affected by seeding rates or how the combination of soil types and seeding rates affected yield.
Computer software including ArcMap and Manifold will likely give you the most flexibility in the data analysis; however, programs like AgLeader SMS and Farmworks are beginning to provide methods for conducting comparison analyses for treatments including seeding and fertilizer rates. Output from these programs can provide a simple table of yield versus seeding rate for simple single-treatment analyses. This information, in turn, can allow you to make a more informed decision regarding choice of seeding rate (and the potential impact on yield) for the next year.
Fig. 10
Fig. 11